Windows Processes, Nefarious Anomalies, and You: Threads

In part 1 of this blog mini-series, we looked at memory regions and analyzed them to find some potential malicious behavior. In part 2, we will do the same thing with enumerating threads.
Nobody explains it better than Microsoft—here is their explanation of what a thread is:
"A thread is the basic unit to which the operating system allocates processor time. A thread can execute any part of the process code, including parts currently being executed by another thread."
Essentially, a thread runs code.
If this is where the malicious code will run, it makes sense to analyze threads from time to time. But before we try to identify anomalies, we need to actually enumerate a thread—that’s up first!
1. Enumerating Threads
A thread is essentially the location from which code begins running. On Windows, a thread will often start from a memory region with calls such as:
There are other ways to execute code from a memory region, but we will focus on these for now.
As an example, the image below shows a ton of threads in WINWORD.EXE, as well as the call stack on thread ID 16160.
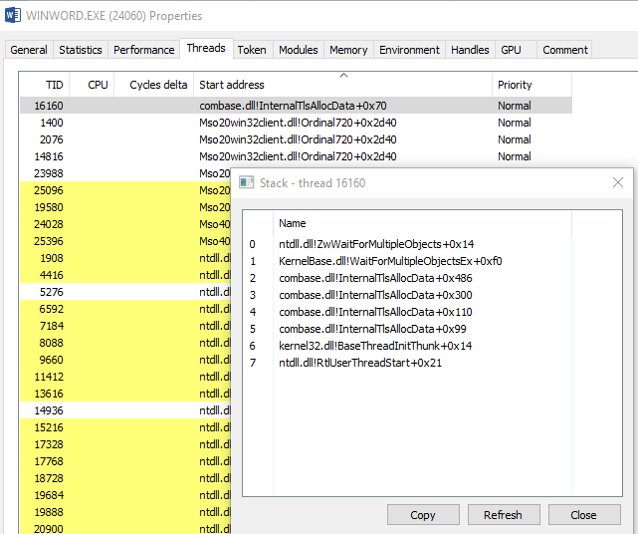
Starting from the bottom, the entry point to this thread was ntdll.dll!RtlUserThreadStart+0x21, which then subsequently made a few calls to do whatever that thread needs to do.
Now, let’s compare that to our implant. Remember, this implant loaded a Reflective Dynamic-Link Library (DLL), and the thread is being started on the memory region allocated for the Reflective DLL.
hThread = ((CREATETHREAD)Api.CreateThread)(NULL, 0, pRoutine, NULL, 0, NULL);
In this case, pRoutine is the exported function from the Reflective DLL. That call stack appears as follows.
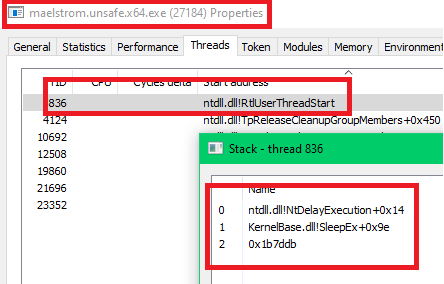
In this process, the thread (836) starts in 0x1b7ddb. This matches up with the base address it was allocated in, 0x1b0000.
This is very uncommon—clicking through other processes, it’s very unlikely to find processes with non-backed entry points. This means that the entry point isn’t a genuine function from a DLL; it's coming from the nether. In the next section, we will discuss how to identify this behavior, but for now, let’s actually identify the threads.
Enumerating threads is just as easy as enumerating the memory regions. The CreateToolhelp32Snapshot Application Programming Interface (API) has a TH32CS_SNAPTHREAD flag that will take a snapshot of all the threads on the host. Doing so will give access to the THREADENTRY32 structure.
typedef struct tagTHREADENTRY32 {
  DWORD dwSize;
  DWORD cntUsage;
  DWORD th32ThreadID;
  DWORD th32OwnerProcessID;
  LONG  tpBasePri;
  LONG  tpDeltaPri;
  DWORD dwFlags;
} THREADENTRY32;
This structure plus some other members will create the structure that we will define for each thread.
typedef struct THREAD_
{
 std::string FullStartAddress = "";
 DWORD ThreadId = 0;
 DWORD Flags = 0;
 DWORD Size = 0;
 DWORD ProcessId = 0;
 LPVOID BaseAddress  = nullptr;
 std::vector<std::string> Callstack;
 FENNEC::Processes::Region Region;
} Thread;
The additional members here are the vector of functions in the call stack and a vector of Region structures from the previous section.
With that out of the way, the code to enumerate threads is easy. It relies on Thread32First and Thread32Next. Additionally, Microsoft has provided an example: "Traversing the Thread List".
As a base, this is the core logic to work through each thread if it matches a given process ID.
HANDLE hSnapshot = CreateToolhelp32Snapshot(TH32CS_SNAPTHREAD, 0);

THREADENTRY32 te = { 0 };

te.dwSize = sizeof(te);

if (Thread32First(hSnapshot, &te))
{
do
{
    if (te.dwSize >= FIELD_OFFSET(THREADENTRY32, th32OwnerProcessID) + sizeof(te.th32OwnerProcessID))
    {
        if (te.th32OwnerProcessID == 0 && te.th32ThreadID == 0) continue;
        if (te.th32OwnerProcessID != dwProcessId) continue;
    }

    te.dwSize = sizeof(te);

} while (Thread32Next(hSnapshot, &te));
We simply loop through every thread in the snapshot by iterating with Thread32Next.
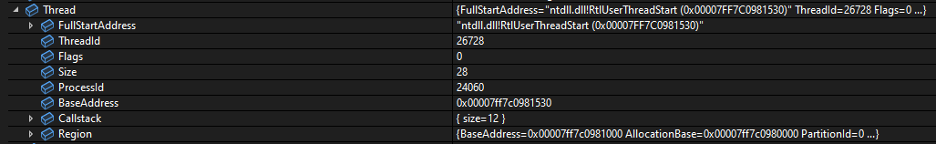
Using WINWORD.EXE as an example again, the information inside the thread structure appears as follows.
There are two additional members we need to fill out that aren’t in the snapshots structure:
- The thread start address
- The call stack
Let’s start with the thread start address. To obtain this, the NtQueryInformationThread from NTDLL is used with the THREADINFOCLASS structure—specifically ThreadQuerySetWin32StartAddress.
typedef enum _THREADINFOCLASS {
    ThreadBasicInformation,
    ThreadTimes,
    ThreadPriority,
    ThreadBasePriority,
    ThreadAffinityMask,
    ThreadImpersonationToken,
    ThreadDescriptorTableEntry,
    ThreadEnableAlignmentFaultFixup,
    ThreadEventPair,
    ThreadQuerySetWin32StartAddress,
    ThreadZeroTlsCell,
    ThreadPerformanceCount,
    ThreadAmILastThread,
    ThreadIdealProcessor,
    ThreadPriorityBoost,
    ThreadSetTlsArrayAddress,
    MaxThreadInfoClass
} THREADINFOCLASS;
Using the call:
PVOID lpStartAddress = nullptr;

NTSTATUS status = NtQueryInformationThread(hThread, static_cast<THREADINFOCLASS>(9), &lpStartAddress, static_cast<ULONG>(sizeof(PVOID)), NULL);
if (!NT_SUCCESS(status))
{
    continue;
}

if (lpStartAddress == nullptr)
{
    continue;
}
lpStartAddress will now hold the base address of the thread. This is cool, and it will let us track down the location from which the thread operated, as we discussed earlier. With that, we can now track down the call stack, which is slightly more complicated.
To “walk the stack,” a few things are needed. First of all, we initial the symbol handler for the process with SymInitialize.
BOOL IMAGEAPI SymInitialize(
  [in]           HANDLE hProcess,
  [in, optional] PCSTR  UserSearchPath,
  [in]           BOOL   fInvadeProcess
);
Like so:
HANDLE hProcess = OpenProcess(MAXIMUM_ALLOWED, FALSE, dwProcessId);
if (hProcess == nullptr)
{
    return Threads;
}
SymInitialize(hProcess, NULL, TRUE);
In order to walk the stack, we must use a few functions:
The theory in this particular section is quite long, so we will not go into too much detail, but these posts are recommended:
First, we set up the STACKFRAME64 structure obtaining a CONTEXT structure of the threads registers.
CONTEXT context = {};

context.ContextFlags = CONTEXT_FULL;

if (GetThreadContext(hThread, &context) == FALSE)
{
    goto cleanup;
}

frame.AddrPC.Offset = context.Rip;
frame.AddrPC.Mode = AddrModeFlat;
frame.AddrStack.Offset = context.Rsp;
frame.AddrStack.Mode = AddrModeFlat;
frame.AddrFrame.Offset = context.Rbp;
frame.AddrFrame.Mode = AddrModeFlat;
Now, the thread’s stack is ready to be walked!
This is done by calling StackWalk64 until it fails.
do
{
    if (StackWalk64(IMAGE_FILE_MACHINE_AMD64, hProcess, hThread, &frame, &context, NULL, SymFunctionTableAccess64, SymGetModuleBase64, NULL) == FALSE)
    {
        break;
    }
} while (true);
Inside this do/while, a SYMBOL_INFO structure is set up.
DWORD64 dwOffset = 0;
char Buffer[sizeof(SYMBOL_INFO) + MAX_SYM_NAME * sizeof(WCHAR)] = { 0 };
PSYMBOL_INFO Symbol = (PSYMBOL_INFO)Buffer;
Symbol->SizeOfStruct = sizeof(SYMBOL_INFO);
Symbol->MaxNameLen = MAX_SYM_NAME;
At this point, we’re ready to query what this address actually is with SymFromAddr. If this works, then cool, we have a function name. If it fails, then we have just an address, which is one of the detections we discussed earlier.
if (SymFromAddr(hProcess, frame.AddrPC.Offset, &dwOffset, Symbol))
{
call = Symbol->Name;
Callstack.push_back(call);
}
else
{
Callstack.push_back(FENNEC::Strings::LPVOID2StringA(reinterpret_cast<LPVOID>(frame.AddrPC.Offset)));
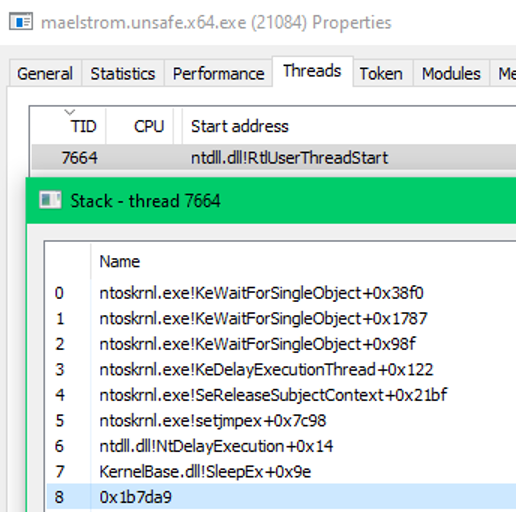
}Each item is appended to the vector, whether it is a valid function or just an address. Then we let it run against Maelstrom.
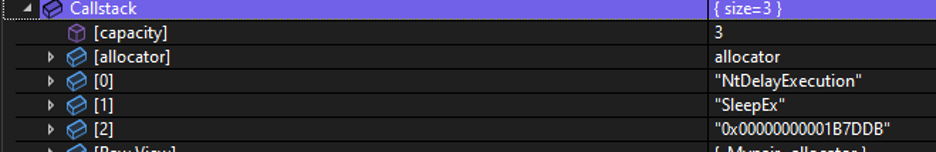
In this vector, we see NtDelayExecution, SleepEx, and then an address—this is what we see in Process Hacker, too. We add a final check here to validate it. This is easy enough with a wraparound GetProcAddress whilst looping over all the modules in the current process.
for (FENNEC::Processes::Module& Module : Modules)
{
    if (GetProcAddress((HMODULE)Module.BaseAddress, FirstCallStackEntry.c_str()) != nullptr)
    {
        ModuleStart = Module.ModuleName;
        break;
    }
}
If GetProcAddress returns an address, then this is where the function belongs, so we can track the module's name.
At this point, we have a vector of enumerated threads with most of the information we will need (foreshadowing). Next, we need to parse the information to identify malicious attributes.
2. Identifying Malicious Attributes in Threads
When looking at threads, there are a few indicators that the process may be up to something nefarious. The easiest indicators to find are specific calls on the call stack, like NtDelayExecution. Or, we can figure out if the thread has originated from private memory. For the more adventurous, Debug Registers can be found on the thread, as seen here.
2.1. Sleeping Threads
In this section we will focus on the latter: specific calls on the call stack and thread originating from private memory.
As a lot of attention has been given to the data structure, checking if these calls are on the call stack is as simple as checking if the vector contains a string:
if (FENNEC::Strings::VectorContainsStringA(Thread.Callstack, "NtDelayExecution"))
{
	Scanner::LogThreadDelay(Thread, Common);
}
If the function is in the call stack, then log it. Obviously, this is quite naive, but it’s just a proof-of-concept.
This is great and all, but let’s build something that relies on Windows determining if the process is in a delayed state. This will require NtQuerySystemInformation.
__kernel_entry NTSTATUS NtQuerySystemInformation(
  [in]            SYSTEM_INFORMATION_CLASS SystemInformationClass,
  [in, out]       PVOID                    SystemInformation,
  [in]            ULONG                    SystemInformationLength,
  [out, optional] PULONG                   ReturnLength
);
To get the information we need, we will need to give it the SystemProcessInformation flag. This returns SYSTEM_PROCESS_INFORMATION.
This function is a bit of a nightmare to use. To get a better understanding of this, threads_util.cpp from pe-sieve is a great reference, alongside "Unique Technique for Iterating through Processes." Let’s look at the code.
In a while loop, NtQuerySystemInformation is called until STATUS_INFO_LENGTH_MISMATCH is hit. When it is, the buffer is set the length of the return length, and the call is reattempted. The goal here is to determine the actual size required, essentially via brute-force. This will appear as follows.
while (status != STATUS_SUCCESS)
{
    status = NtQuerySystemInformation(SystemProcessInformation, SystemInformation, SystemInformationLength, &ReturnLength);

    if (status == 0xC0000004)
    {
        free(SystemInformation);
        SystemInformation = nullptr;
        SystemInformationLength = 0;
        SystemInformation = (LPVOID)calloc(ReturnLength, 1);
        if (!SystemInformation) {
            return Thread;
        }
        SystemInformationLength = ReturnLength;
        continue;
    }
    break;
};
This is a bit confusing, but once it has iterated and found the correct size, it will no longer hit the mismatch error, thus breaking out of the loop.
Once that is done, the buffer returned from NtQuerySystemInformation can be cast.
SYSTEM_PROCESS_INFORMATION* ProcessInfo = (SYSTEM_PROCESS_INFORMATION*)SystemInformation;
ANOTHER while loop is entered. This now iterates through the SYSTEM_PROCESS_INFORMATION object by incrementing over the NextEntryOffset.
while (ProcessInfo)
{
    ProcessInfo = (SYSTEM_PROCESS_INFORMATION*)((ULONG_PTR)ProcessInfo + ProcessInfo->NextEntryOffset);
}
We almost have the data we need.
Next, we need to iterate over the number of threads in the structure, while checking if the thread ID is what we are need
for (size_t i = 0; i < ProcessInfo->NumberOfThreads; i++) {
    if (((ULONGLONG)ProcessInfo->Threads[i].ClientId.UniqueThread & 0xffffffff) == Tid)
    {

    }
}
Note the ‘bitwise AND’ operation, which is shifting the UniqueThread by 0xffffffff.
After all of that, we get the following information.
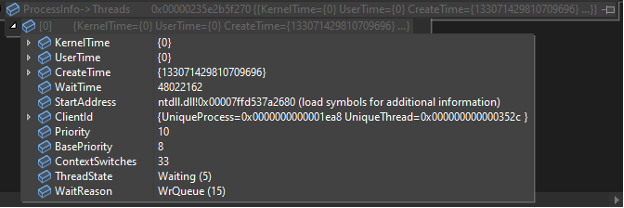
By doing all that, we get access to the SYSTEM_THREAD_INFORMATION structure.
typedef struct _SYSTEM_THREAD_INFORMATION
{
    LARGE_INTEGER KernelTime;
    LARGE_INTEGER UserTime;
    LARGE_INTEGER CreateTime;
    ULONG WaitTime;
    PVOID StartAddress;
    CLIENT_ID ClientId;
    KPRIORITY Priority;
    LONG BasePriority;
    ULONG ContextSwitches;
    KTHREAD_STATE ThreadState;
    KWAIT_REASON WaitReason;
} SYSTEM_THREAD_INFORMATION, * PSYSTEM_THREAD_INFORMATION;
The full function appears as follows.
FENNEC::Processes::Thread FENNEC::Processes::GetExtendedThreadInfo(DWORD Tid)
{
FENNEC::Processes::Thread Thread;
LPVOID SystemInformation = nullptr;
ULONG SystemInformationLength = 0;
ULONG ReturnLength = 0;
NTSTATUS status = STATUS_UNSUCCESSFUL;
while (status != STATUS_SUCCESS)
{
status = NtQuerySystemInformation(SystemProcessInformation, SystemInformation, SystemInformationLength, &ReturnLength);
if (status == 0xC0000004)
{
free(SystemInformation);
SystemInformation = nullptr;
SystemInformationLength = 0;
SystemInformation = (LPVOID)calloc(ReturnLength, 1);
if (!SystemInformation) {
return Thread;
}
SystemInformationLength = ReturnLength;
continue;
}
break;
};
if (status != STATUS_SUCCESS)
{
free(SystemInformation);
return Thread;
}
SYSTEM_PROCESS_INFORMATION* ProcessInfo = (SYSTEM_PROCESS_INFORMATION*)SystemInformation;
bool bFound = false;
while (ProcessInfo)
{
ProcessInfo = (SYSTEM_PROCESS_INFORMATION*)((ULONG_PTR)ProcessInfo + ProcessInfo->NextEntryOffset);
for (size_t i = 0; i < ProcessInfo->NumberOfThreads; i++) {
if (((ULONGLONG)ProcessInfo->Threads[i].ClientId.UniqueThread & 0xffffffff) == Tid)
{
Thread.ThreadState = FENNEC::Strings::StateToString(ProcessInfo->Threads[i].ThreadState);
Thread.WaitReason = FENNEC::Strings::WaitReasonToString(ProcessInfo->Threads[i].WaitReason);
Thread.WaitTime = ProcessInfo->Threads[i].WaitTime;
bFound = true;
break;
}
}
if (bFound == true)
{
break;
}
}
return Thread;
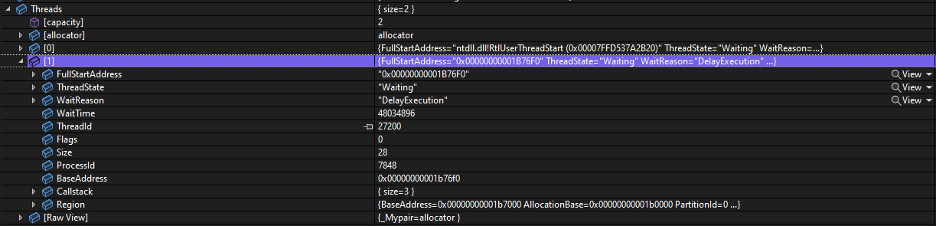
}Letting this run against the implant, we now have the DelayExecution enum.
Now the detection code can be simplified to the following.
if (Thread.WaitReason, "DelayExecution")
{
	Scanner::LogThreadDelay(Thread, Common);
}
We didn’t save much code, but we’ve determined that the thread is 100% in a delayed state, as opposed to checking the call stack.
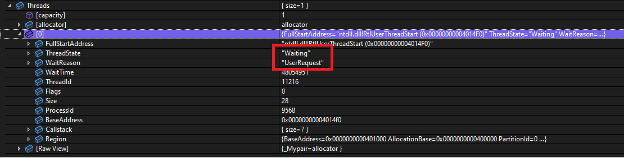
If we switch the sleep to WaitForSingleObject, it fits in with the noise a lot more, as it is harder to determine that the thread is sleeping.
2.2. Thread Origin
Checking the origins is slightly more complicated. First, we check if the first item in the call stack starts with 0x, as that’s how strings are being formatted. If that matches, get the actual address from the string.
if (FENNEC::Strings::StringAContainsA(Call, "0x"))
{
    LPVOID lpAddress = FENNEC::Strings::StringA2LPVOID(Call);
}
With that, next up is looping over all regions and checking if the thread address is within the specific page.
bool bPrivateMem = false;

for (FENNEC::Processes::Region& Region : Process.Regions)
{
	if (FENNEC::Processes::IsMemoryInRegion(lpAddress, Region.BaseAddress, Region.Size) == true)
	{
		if (Region.Use.empty())
		{
			bPrivateMem = true;
			break;
		}
	}
}
If it’s within the range, then check if the region structure has a use applied to it. In the case of the data structure, this means it is associated with a DLL.
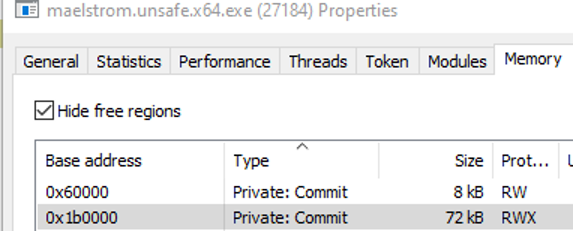
If it’s set to 'true', then we can log it. As an example, the Reflective DLL’s thread starts at 0x1b7da9.
This is within the RWX region allocated for the Reflective DLL.
Finally, note how there is no DLL and it is Private: Commit.
There’s a big however here: tons of false positives.
Tracking this down, it’s because .NET does not live by any of the natural rules. This bit was quite interesting dive into the PEB, so I will leave this as a task for the reader. However, here is the reference: The CLR Header.
After eradicating .NET, the line count is down to 58. With a new bug, devenv.exe:
This will remain a bug for another day!
Here is the log for detecting NtDelayExecution.
{
  "data": {
    "allocation_base": "0x00000000001B0000",
    "base_address": "0x00000000001B7000",
    "callstack": [
      "NtDelayExecution",
      "SleepEx",
      "0x00000000001B7DA9"
    ],
    "flags": "0",
    "method": "Thread Sleeping (NtDelayExecution)",
    "partition_id": "0",
    "process_id": "27184",
    "region_allocation_initial": "PAGE_EXECUTE_READWRITE",
    "region_protection_active": "PAGE_EXECUTE_READWRITE",
    "region_size": "45056",
    "region_state": "MEM_COMMIT",
    "region_type": "MEM_PRIVATE",
    "start_address": "0x00000000001B76F0",
    "thread_id": "836",
    "use": ""
  },
  "event_category": "Memory Scanner",
  "event_time": "Wed Sep  7 11:39:13 2022",
  "guid": "a098d87b-808a-42dd-8997-0d69355914e2",
  "image_name": "maelstrom.unsafe.x64.exe",
  "image_path": "\\Device\\HarddiskVolume11\\maelstrom\\agent\\stage0\\bin\\maelstrom.unsafe.x64.exe",
  "parent_procecess": 18056,
  "process_id": 27184
}
Here is the log for tor threads origin.
{
  "data": {
    "allocation_base": "0x00000000001B0000",
    "base_address": "0x00000000001B7000",
    "callstack": [
      "NtDelayExecution",
      "SleepEx",
      "0x00000000001B7DA9"
    ],
    "flags": "0",
    "method": "Thread Origin is Memory Region",
    "partition_id": "0",
    "process_id": "27184",
    "region_allocation_initial": "PAGE_EXECUTE_READWRITE",
    "region_protection_active": "PAGE_EXECUTE_READWRITE",
    "region_size": "45056",
    "region_state": "MEM_COMMIT",
    "region_type": "MEM_PRIVATE",
    "start_address": "0x00000000001B76F0",
    "thread_id": "836",
    "use": ""
  },
  "event_category": "Memory Scanner",
  "event_time": "Wed Sep  7 11:39:13 2022",
  "guid": "a098d87b-808a-42dd-8997-0d69355914e2",
  "image_name": "maelstrom.unsafe.x64.exe",
  "image_path": "\\Device\\HarddiskVolume11\\maelstrom\\agent\\stage0\\bin\\maelstrom.unsafe.x64.exe",
  "parent_procecess": 18056,
  "process_id": 27184
}
3. Conclusion
In the first part of this mini-series, we covered anomalies within memory regions and found some ways to determine if that region had some nefarious qualities. In this post, we did the same thing for threads. There are many more of these techniques to add to something like this, but this will cover the low-hanging fruits.
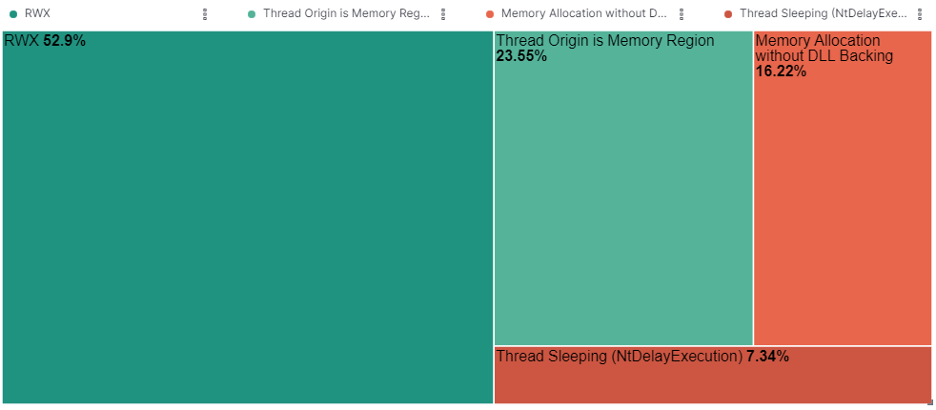
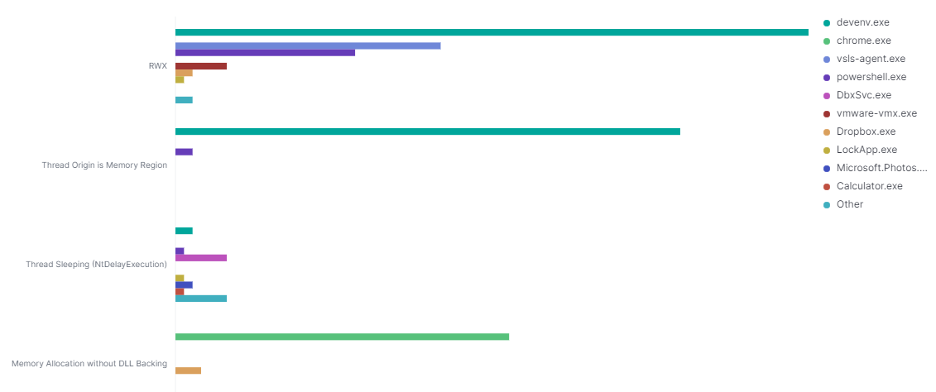
As a bonus, here are some visualizations generated from Kibana based on the JSON gathered throughout this process, which are quite interesting—they show the general statistics with no implants running on a development machine. Make of it what you will.